HandsOn 10 - Coin Flipping
Now
let's find out what is the real outcome of flipping a coin ten times.
If you are using this site in a classroom setting, work in groups
of two or three. Save time by "flipping'' ten coins at once:
Shake up ten coins between your cupped hands and throw them on the
table. Count the number of heads and report this number to the group
member who is keeping record. Shake up the ten coins and drop them
again. Again count the number of heads and report this number. Each
group does this ten times.
Table
3.1: Guess the results of 10 flips by each of 1000 students.
Sketch your prediction by drawing a bar graph or histogram on
a copy of Figure 3.1.
|
| |
| |
No.
of Students |
| No.
of Heads |
(out
of 1000) |
| 10
|
|
| 9
|
|
| 8
|
|
| 7
|
|
| 6
|
|
| 5
|
|
| 4
|
|
| 3
|
|
| 2
|
|
| 1
|
|
| 0
|
|
|
| |
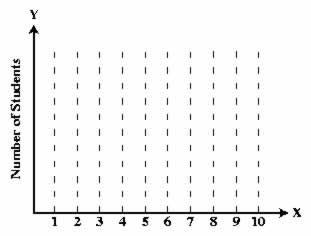
Figure 3.1: Bar graph (a simple histogram) of number of students
vs. number of heads to be completed when the "process'' of
flipping coins is completed. Make your own scale (divisions) on
the vertical axis.
|
Q3.5: Does throwing down ten different coins give the
same results as flipping a single coin ten times? What
assumptions do you make in answering this question:
assumptions about whether different coins are identical
or not and assumptions about the independence of each
coin flip?
|
|
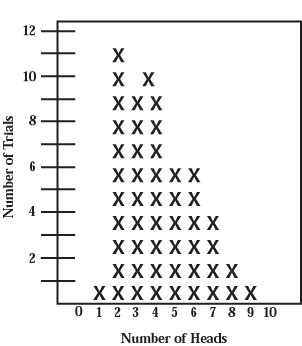
Now combine the results for all the groups in the class. Have someone
make a graph like the one in Figure on the board. Place a large
X on the graph for the result of each trial, stacking the X's on
top of one another.
Figure
3.2: One possible histogram of the number of heads when 10 coins
are flipped in 50 trials. Each X represents the result of one trial.
|
Q3.6: Meet with your group and discuss the results plotted
on the combined graph. Do they look like what you predicted?
Is the graph uneven in shape? Why or why not? What would
the graph look like after 1000 trials?
|
|
|
Q3.7: Did certain numbers of heads occur more often than
others?
|
|
|
Q3.8: What number of heads is the most likely
to occur? What fraction of the time does that actually
happen? |
|
|
Q3.9: Were there any trials that resulted in zero heads
or ten heads?
|
|
|
Q3.10: Why is the distribution lopsided? If we did this
again, could the new distribution be lopsided the other
way? Why or why not?
|
|
|
Q3.11: Based on this activity, would you predict the same
histogram for 1000 trials as you guessed earlier? If not,
what would you predict the histogram will look like for
1000 trials? Make new entries to the right of your copy
of Table 3.1. In general, what do
you expect will happen as the number of trials is increased?
Would the distribution remain lopsided? Make a guess before
going on to the computer activity where you will able
to verify your prediction.
|
|
|
|
|
Previous: 3.2
- Observed Distributions