SimuLab 3: Qualitative Investigation of Boyle's Law

Gas creates pressure because its particles collide with the walls of their container. The concept of moving gas molecules is the foundation of the kinetic molecular theory.


Your objective is to:


Recognize the effect of molecular collisions with the piston on the piston's position.

You will be able to:


Predict what happens to the position of the piston when the external pressure is greater than the internal pressure of the gas.


Explain why the position of the piston fluctuates when the external and internal pressures are approximately equal.


Describe gas pressure in terms of molecular collisions.


State the relationship between frequency of collision and the volume of a given gas sample.


    1. Open SMDPlayer, select IntroBoyle'sLaw in the IdealGas folder. PRESS Play. Read all the captions, and follow the instructions. Go to File - Quit

      Movie gives a preliminary understanding of Boyle's law from a microscopic point of view.


    2. Open SMD, select Boyle-Preliminary in the IdealGas folder.

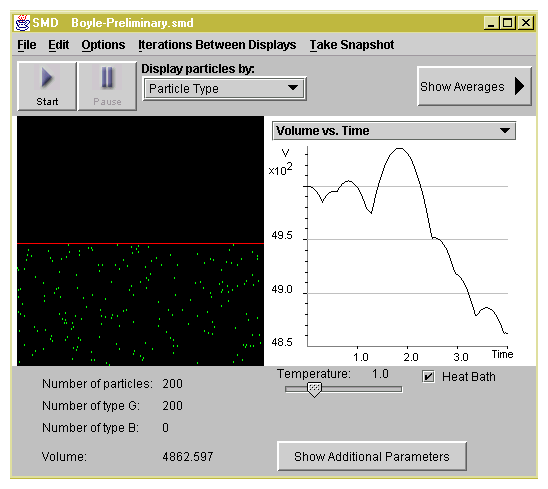
    You see 200 green gas molecules under a piston represented by a red bar, as shown in Figure 2.1. Note that the Heat Bath is on, which means that the temperature of the system is kept relatively constant throughout the experiment. The system is NOT thermally isolated.


    3. Set Iterations Between Displays to 10. Select Display Particles by Trajectories and press Start.

    The particles start to move along straight lines with various velocities. They change their trajectories when they collide with the piston or each other.


    4. Click back to Display Particles by Particle Type and observe the Volume versus Time graph.

    The external pressure acting on the piston accelerates it downward, reducing the volume of the gas. In the absence of collisions with the piston, a graph of volume versus time is a smooth parabola because the piston falls freely. However, when a molecule collides with the piston, the piston's velocity instantly changes and the graph as a whole changes into a set of parabolic segments. The connections of parabolic segments illustrate numerous collisions that create internal pressure which pushes the piston upward.


figures2/pic1c.png
Figure 2.1: Screenshot of Boyle's Law SimuLab.


    5. Watch the graph for approximately 4 time units (until the graph fills the screen) and then press Pause. To copy the graph to the Snapshot Gallery'' select Take Snapshot :Graph.


    Determine the number of particle collisions with the piston by counting the number of parabolic segments as shown in Figure 2.2.


figures2/pic2.png
Figure 2.2: Determining the number of molecules collisions with the piston by counting the parabolic segments. The end of a parabolic segment is indicated by a jaggedness in the curve. When the number of parabolic segments is unclear-estimate. In this graph, there are 7 or 8 collisions (parabolic segments).


Q2.9: How many collisions with the piston (i.e., parabolic segments) did you count?


    6. To speed up the program, set Iterations Between Displays to 1000 and press Start. Run the program for 200 time units (read Time from Averaging Window).

    At equilibrium, the internal pressure created by the gas molecules colliding with the piston, should be equal to the external pressure, which is set at 0.04. The internal pressure value can be found in the Average Values panel. The external pressure value can be found in the Additional Parameters window by selecting Show Additional Parameters. Read the volume of the gas from the Average Values panel and record it. While running this simulation answer the following questions:


Q2.10: Notice that relatively few particles collide with the piston at any particular moment. Will this cause the internal pressure to (a) stay the same, (b) fluctuate a little, or (c) fluctuate greatly? Explain your reasoning.


Q2.11: If the external pressure is greater than the internal pressure, what will happen to the piston?

If the external pressure is less than the internal pressure, what will happen to the piston?


Q2.12: If the internal pressure is averaged over an extended period of time and we wait until the system comes to equilibrium, will the average internal pressure be (a) higher, (b) lower, or (c) equal to the external pressure? Explain your reasoning.


Q2.13: At equilibrium, what happens to the piston?


Q2.14: What happens to the volume of a gas at equilibrium? Does this happen in our simulation?


Q2.15: What role, if any, does the number of particles in our simulation have on the fluctuations in volume at equilibrium?


Q2.16: Describe the equilibrium state for a gas contained in a container with a piston.


    7. Press Pause. Double the External Pressure to 0.08.


Q2.17: According to Boyle's Law, predict what should happen to the average volume when we double the external pressure.


    8. Select Reset Averages on the Average Values panel. Press Start.

    By resetting averages you eliminate the data from the previous stage of the experiment when the pressure was 0.04.


Q2.18: Describe what happens to the piston position and explain why. What happens to the volume of gas?


    9. Select the Pressure versus Time graph on the Graph panel. When the internal pressure value displayed on the graph is approximately equal to the external pressure, press Pause. Record the volume of the gas from the main window.

    You are observing the gas system approaching equilibrium where the internal and external pressure are approximately equal.


Q2.19: How does the volume you recorded compare to your prediction? To what extent are the simulation results consistent with Boyle's Law?


    10. Set Iterations Between Displays back to 10. Select the Volume versus Time graph on the Graph panel. Press Start. Watch the graph for approximately 5 time units (until graph fills the screen). Press Pause. Copy the graph to the Snapshot Gallery'' by selecting Take Snapshot : Graph.

    Determine the number of particle collisions with the piston by counting the number of of parabolic segments, which represent the number of particle collisions with the piston.


Q2.20: How do the two graphs compare in terms of the number of parabolic segments? Propose an explanation for the observed 1 to 2 ratio.


Q2.21: How does the change in volume relate to the frequency of collisions with piston?


Q2.22: How does the change in frequency of collisions relate to the change in internal pressure?