SimuLab 13: Kinetic and Potential Energies of Particles in Gas State


Your objective is to:


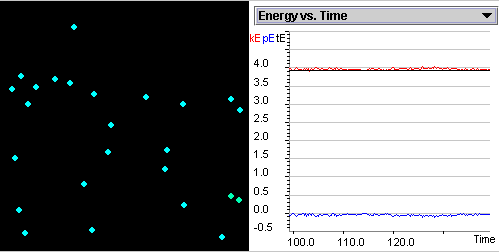
Investigate the correlation between the kinetic, potential energies and temperature as gas particles move and collide.


You will be able to:

Define potential energy and kinetic energy and give an example of each.

Discuss the relationship among potential energy, kinetic energy, and total energy before, during, and after a two-particle collision at a given temperature.


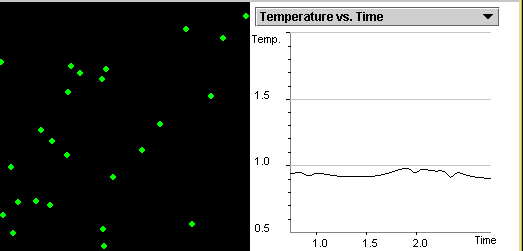
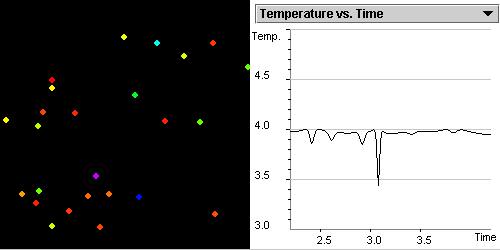
State the relationship between the average kinetic energy of randomly moving particles and the temperature of the system.


Describe what happen to the speed of particles in a system as the temperature is raised.


    1. Open SMD, select Experiment25 in the Energy folder. Press Start. To speed up the simulations set Iterations between Displays to 5

    You are visualizing a low-density gas, see Fig. 3.3. There is no exchange of energy with the surroundings (i.e. the system is thermally isolated). Thus the total energy of the system is conserved. Each gaseous particle moves along a straight line until it collides with another particle or with the container walls.

figures1/SLC01.1.gif

Figure 3.3: You are visualizing 25 green gas particles at temperature T = 1. The temperature T=1 is far above the boiling point of the substance.


    Observe the graph Temperature vs. Time (see Fig. 3.3).
     The temperature T reading below the screen is an exact computation of the average kinetic energy, Ek of a particle in the system, T = ((mv2)/2 )avg. The temperature is calculated at every simulation step: the program calculates the kinetic energy mv2/2 for every particle, adds them together and divides by the total number of particles.


Q3.8: Describe the graph and explain why the temperature is not constant?


    2. Pause the simulation. Using the scroll-bar, increase the temperature from the current value T=1.0 to a new value T=4.0 and press Start.


Q3.9: Do the molecules move faster or slower? Explain.


    3. In order to visualize the change in the kinetic energy of the individual particles, switch the menu Display Particles by to Absolute Kinetic Energies as shown in Fig. 3.4.

    Some of the particles are violet, blue, green, yellow and red. The color of each particle indicates the amount of kinetic energy it has as you can see from the Spectrum of Kinetic Energies. The violet particles have the highest kinetic energy (move at the highest speed), then come the blues, then green, then yellow, and then red, which have the lowest kinetic energy (move at the lowest speed). When they collide, their colors change.


Q3.10: What do the changing colors indicate about the particle's kinetic energies as they collide?


figures1/SLC01.2.gif

Figure 3.4: A snapshot of the application screen representing the same gas as in Fig. 3.3, but at temperature 4. The color of each particle indicates its kinetic energy.


    4. Switch the menu Display Particles by to Potential energy.

    The color coding now indicates the value of each particle's potential energy as you can see in the Spectrum of Potential Energies. Most of the particles are so far away from each other that there is almost no interaction between them. Their potential energy is assigned a value of zero and colored light blue. The particles that are close to each other have a negative potential energy and are colored green.

    5. Go to Options - Select Delay and select Short Delay.

      You are selecting a short delay to better see the changes of potential energy of colliding particles. When two particles collide, the potential energy increases and the kinetic energy decreases. The total energy of the interaction remains constant. The increase in potential energy of the two particles is indicated by a change of color to dark blue and violet. The decrease in kinetic energy of the two particles is indicated by the dip in temperature on the temperature graph.


    6. Switch the Graph to Energies. Turn off the delay.

    On the energy graph the average kinetic energy of the particles is indicated by the red line, the average total energy of the particles is indicated by the black line, and the average potential energy of the particles is indicated by the blue line.
    The total energy is constant as is reflected in the flatness of the black line (see Fig. 3.5).


Q3.11: Try to explain the peaks in the graph of kinetic and potential energies. Why are they complementary? Clue: Watch if they correspond to the moment of a collision


.


Q3.12: Why does the total energy of the system-which is the sum of its kinetic and potential energy-remains constant?


figures1/SLC01.3.gif

Figure 3.5: The same system as in Fig. 3.4. The color of each particle now indicates its potential energy. A pair of colliding particles with a positive potential energy appears in bright magenta. The graph showing potential energy vs. time (bottom curve) indicates the maximum at the time of collision (Time » 9.75). The graph showing kinetic energy (top curve) indicates the minimum at that point. The fluctuations of kinetic and potential energies are, in fact, complementary (in the sense that peaks in potential energy correspond to dips in kinetic energy, and vice versa)-and the total energy of the system, indicated by a straight black line, is constant.