SimuLab 1: Temperature and the State of Matter


Your objective is to:


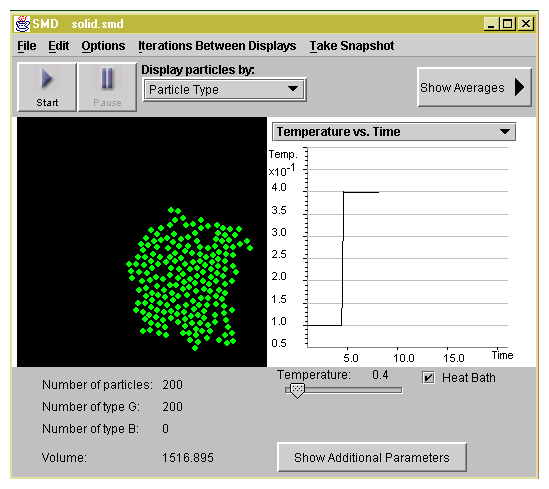
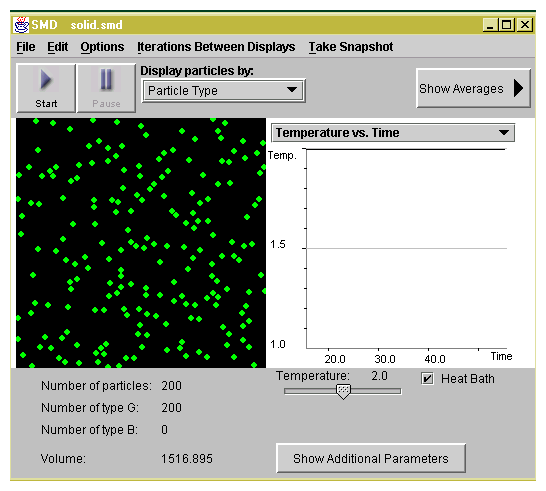
Recognize the differences between solid, liquid, and gas from the microscopic point of view.

You will be able to:


Describe the phase transition from liquid to solid and from liquid to gas in molecular terms.


Contrast the motion of particles in the solid, liquid and gaseous phase.


Describe a liquid-gas equilibrium.


Describe the relationship between states of matter and temperature.


Q1.6: Describe, in drawings and in words, your conception of the molecular structure of a substance in the solid, liquid, and gas states.


Q1.7: Describe what happens when we heat a solid in terms of particle motions and overall structure?


    1. Open SMDPlayer, select IntroStatesofMatter from the StatesofMatter folder. Press Play. Study the captions and follow the instructions. When you are finished, select File - Quit
     This is an introductory movie that visualizes the three states of matter at the molecular level and the effect of increasing temperature.


Q1.8: In the introductory movie we saw that as we increase the temperature, solid melts into liquid and liquid evaporates into gas. Describe, in drawings and in words, what would happen as we decrease the temperature of a gas? (Answer such questions as: Do the molecules move faster or slower? Does the gas expand or condense?)


    2. Open SMD, select Solid in the States of Matter folder. Press Start. In order to speed the simulation switch Iterations Between Displays to 100.
      In this experiment you are visualizing 200 particles at the molecular level. The particles are in the solid state at temperature T=0.1 as shown in Figure 1.1. Our program uses computer units for all the parameters. You can see temperature and all the other parameters in real units by selecting Show Averages and then selecting Show Real Units.


figures1/solidc.png

Figure 1.1: You see 200 particles at a temperature far below the freezing point of the substance we are simulating. The horizontal axis of the graph shows the simulation time. The vertical axis shows the temperature of the system. The particles are frozen in a triangular crystal.


    3. Select Display Particles by: Trajectories. Wait no more than 10 time units. Pause the simulation. Select Take a Snapshot - Screen. When the dialog box with the Title of the Picture appears type in: Solid (T=0.1)'' and press Ok.
      You are saving a snapshot of the trajectories of particles in the solid state for later comparison. Trajectory is another word for the path a particle travels over time.


Q1.9: Which phrase best describes the trajectories of particles. The particles appear to be . . .''

(a) fixed in position

(b) slightly wobbling around a fixed position

(c) moving along in curved lines

(d) moving along straight lines


    4. Select Display Particles by: Particle Type. Using the scroll-bar increase the Temperature to T = 0.4. Press Start. Wait at least 20 time units for the particles to spread.
     As the temperature increases, the regular pattern of the solid is destroyed as shown in Figure 1.2. The molecules begin to move more freely.


figures1/liqc.png

Figure 1.2: Your system undergoes a phase transition from the solid state to the liquid state. The graph shows the change in the temperature that you made in Step 4.


Q1.10: Predict what would happen if you lower the temperature back to T = 0.1. Time permitting, check you prediction. Make sure you then set the temperature back to T = 0.4 and wait again for 20 time units before proceeding to Step 5.


    5. Select Display Particles by : Trajectories. Wait no more than 5 time units. Pause the simulation. Select Take a Snapshot - Screen. When the dialog box with the Title of the Picture appears type in: Liquid (T=0.4)'' and press Ok.
     You will compare the trajectories of the particles in the liquid state with trajectories of particles in the solid state.


Q1.11: Describe the differences between your snapshots of trajectories from Solid (T=.1)'' and Liquid (T=.4).'' Your descriptions should include a comparison of the particle motion between the two states.


    6. Select Edit - Reset Trajectories and press Start. If the trajectories get too cluttered, select again Edit - Reset Trajectories.

     Observe that some particles leave the liquid state and move in straight paths. These gas particles sometimes rejoin the liquid state and sometimes leave it. You are visualizing two states of matter at equilibrium.


Q1.12: What real-life examples can you list where a gas and liquid co-exist in the same system?


Q1.13: Which phrase best describes the trajectories of particles in the liquid phase . The particles appear to be . . .''

(a) fixed in position

(b) slightly wobbling around a fixed position

(c) moving along in curved lines

(d) moving along straight lines


    7. Pause the simulation. Switch Display particles by: Particle Type. Using the scroll-bar increase the Temperature to T = 2. Press Start and wait at least 20 time units.
      As the temperature is increased, the particles leave the liquid state and become gas as shown in Figure 1.3.


Q1.14: Which phrase best describes what is happening as the particles begin to fill your container. The particles are . . .''

(a) melting

(b) freezing

(c) evaporating


figures1/gasc.png

Figure 1.3: A snapshot visualizing the gas state.


    8. Switch Iterations Between Displays to 5. Switch Display Particles by: to Trajectories. Wait 5 time units. Pause the simulation. Select Take a Snapshot - Screen. When the dialog box with the Title of the Picture appears type in: Gas (T=2)'' and press Ok.
      You will compare the trajectories of the particles in the gas state with trajectories of particles in the solid and liquid states.


Q1.15: What are the differences between the trajectories in the liquid and gas states? Try to explain why the trajectories are different.


Q1.16: Using your snapshot gallery, describe the differences in the three states of matter in terms of particle motion.


Q1.17: Describe in drawings and in words how the state of matter is related to temperature.


    9. Switch Iterations between Displays to 100. Select File- Reset Experiment.
      You can further investigate the trajectories of individual particles in the three states of matter.


    10. Select Edit - Select Particle and choose one particle at the center of the solid. Select Display Particles by: Selected Trajectories and press Start. After 10 time units, Pause the simulation. Raise the Temperature to T = 0.4 and press Start. For approximately 20 time units, observe the changes in the trajectory of your selected particle. Pause the simulation and increase the Temperature to T = 2. Press Start. Watch the trajectory of your chosen particle for another 20 time units. Press Pause.
     You are watching the behavior of the chosen particle at different temperatures.


Q1.18: Explain the changes observed in the particle trajectory as the temperature is raised.


    11. Select Take a Snapshot - Screen. When the dialog box with the Title of the Picture appears, type Center''.
      You will compare this center'' particle with a particle from the edge'' of the solid.


    12. File -Reset Experiment. Repeat the step 10 but now select particle from the edge of the solid.

    13. Select Take a Snapshot - Screen. When the dialog box with the Title of the Picture appears, type Edge''.


Q1.19: Compare your snapshots Center'' and Edge''. Do you see any difference in the trajectories in the two different cases of initial position. Explain.