|
~ You see a Gas of 1000 particles. There are particles of two types: Red and
Blue. In this movie they are identical, so you can think on them as different
isotopes of the same element. We will study what will happen with the melting
point if we change their chemical properties. Each particle has diameter rAB
= rAA = rBB = 4 and interaction range RAB
= RBB = RAA = 7.4. Initially the system is in the gaseous
phase. Each frame of the movie correspond to 100 computer units. The heat
exchange coefficient is 10-4 and the thermostat temperature is 0.01.
2. Watch the temperature, potential energy and total energy graphs. Press
Forward.
|
|
|
3. Rewind the movie till the frame 550. Open Averaging for Movies from
the menu. Press Forward and measure the pressure and temperature until
the frame 750. Press Stop.
~ This values must be close to the values of the triple point. However as
the crystal is growing (See Sect.2.2.1)
those values can be a slightly smaller than the true triple point values.
~ Copy the table below:
| time | temperature | PotE | Total E | Pressure |
| 50 | ||||
| 100 | ||||
| 150 | ||||
| 200 | ||||
| 250 | ||||
| 300 | ||||
| 350 | ||||
| 400 | ||||
| 450 | ||||
| 500 | ||||
| 550 | ||||
| 600 | ||||
| 650 | ||||
| 700 | ||||
| 750 | ||||
| 800 | ||||
| 850 | ||||
| 900 | ||||
| 950 | ||||
| 1000 |
4. Rewind the movie till beginning. Reset the Averaging for Movies
window and record the values of temperature, pressure potential and total
energies into the table each 50 frames till frame 1000. Press Forward.
|
~ This graph corresponds to the crystallization curve.
|
|
5. Close Movie and Open the movie melting.mov.
6. Watch the movie from the beginning to the end. Find the time when the
crystallization ends that is the beginning of melting.
~ Copy the table below:
| time | temperature | Pressure |
| 50 | ||
| 100 | ||
| 150 | ||
| 200 | ||
| 250 | ||
| 300 | ||
| 350 | ||
| 400 | ||
| 450 | ||
| 500 | ||
| 550 | ||
| 600 | ||
| 650 | ||
| 700 | ||
| 750 | ||
| 800 | ||
| 850 | ||
| 900 | ||
| 950 | ||
| 1000 |
7. Rewind the movie till beginning. Reset the Averaging for Movies
window and record the values of temperature and pressure potential into
the table each 50 frames till frame 1000. Press Forward.
|
8. Find the triple point pressure by averaging the pressure during melting
and freezing.
|
|
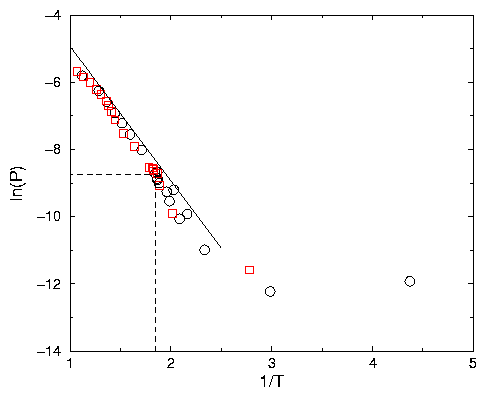
~ Note that above T = 0.73 both curves coincides. Below T = 0.73 and above
the triple point the curve corresponding to heating of the substance has
lower pressure than the curve corresponding to the cooling.
|
~ Note that the region of both curves between T = 0.73 and the triple point
is relatively straight, this kind of behavior in that region is called the
Arrhenius behavior which is very important in many chemical reaction.
|
~ The meaning of this slope is the activation energy of evaporation. It
means that an atom leaving the liquid state and entering in the gaseous
state must gain a potential energy of 4. For further discussion see Sect. 2.2.1.
~ Below the freezing point we can see the branch of the curve with larger
slope. This slope correspond to the equilibrium of gas with crystal. Below
T = 4.5 the points are not accurate enough because there are few atoms in
the gaseous state in our simulation to produce accurate measurements. Discard
those points and
|
~ Note that below the freezing point the equilibrium pressure of Gas near
the crystal is lower that for Liquid. Above the freezing point the equilibrium
pressure of Gas near liquid is lower that for crystal. Close movie.
| p ~ exp(- | m v2
2 kB T |
) |
| exp( | -H
2 kB T |
) |
|
|
(2.1) |
So if we plot ln(P) as a function of 1 / T the arrhenius plot is a straight line. In our simulation kB = 1 and thus the slope is -H, where H is the potential energy per atom in the liquid.
A2.15: As the temperature goes down, gas start to condense, it forms a compact
droplet surrounded by few molecules. Finally a little crystal appears inside
the droplet . At this point the temperature goes up and stays at the plateau
as the crystal grows. Once the liquid crystallize the temperature starts to
go down again. As the temperature decreases the number of particles in the gaseous
phase decreases.
A2.16: The liquid emerges at t = 10000 (100 frames). The crystal at t = 50000
(500 frames) and stops at t = 75000 (750 frames).
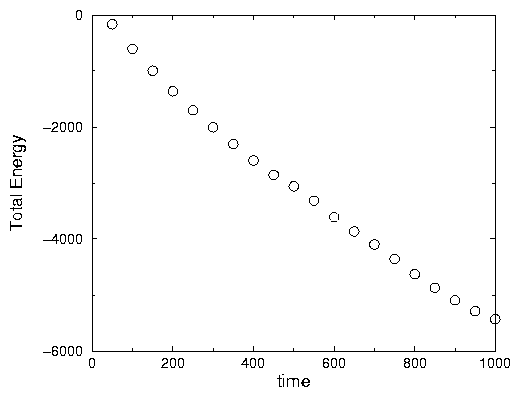
A2.17: The temperature goes down because we take away energy from the system,
almost at constant rate. At first the rate at which the temperature changes
is fast because almost all the heat is taken from the kinetic energy of the
Gas See Sect2.2.1.
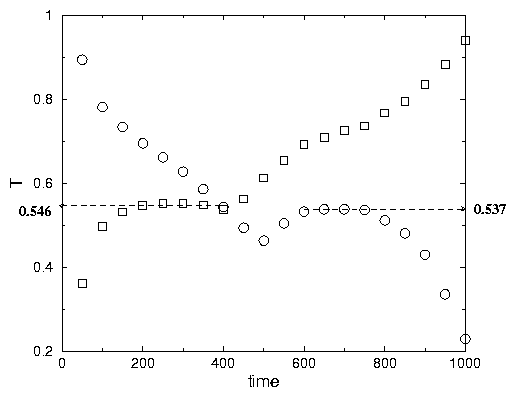
A2.18: The plateau region corresponds to the crystallization temperature. The
crystallization temperature is T = 0.537 (See Fig .2.3)
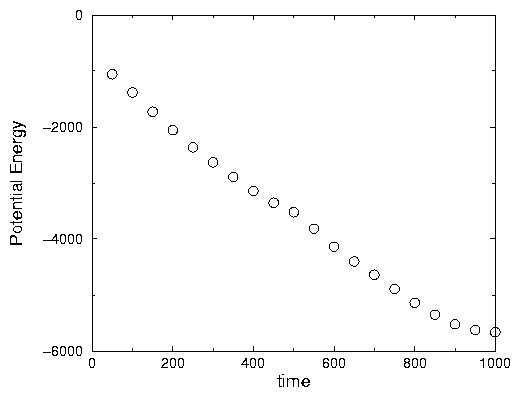
A2.19: Theses graphs are monoatomic since we take out the heat from the system
almost at constant rate (See Fig .2.4).
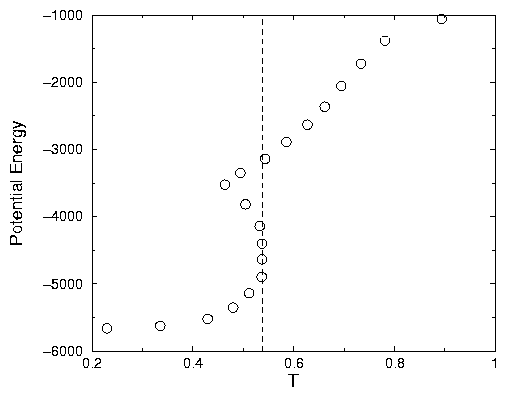
A2.20: In the graph of the potential energy as a function of the temperature
we see a region of regular liquid above the critical temperature of crystallization
(T = 0.537) (See Fig. 2.5). Below the freezing point
the liquid in a supercooled state coexist with the crystal. At the critical
point we see a plateau characteristic of a phase transition where liquid and
crystal coexist. The height of this plateau is the latent heat of crystallization
which value is 1722.
A2.21: The melting temperature is 0.546 and corresponds to the plateau in Fig .2.3
. During freezing it was 0.537. The difference is 0.01. During melting the liquid
was growing. The equilibrium was shifted towards the liquid state. The crystal
was superheated. Hence the temperature was higher that during freezing when
the equilibrium was shifted towars crystalline state and the liquid was supercooled.
One can expect that the true equilibrium temperature is somewhere in between
and we can assume that it is 0.542 ±0..05 which is also the triple point temperature because the gas is also at equilibrium.
A2.22: During melting the pressure is 1.81 ·10-4. During freezing it is 1.42 ·10-4. The average pressure is the 1.6 ·10-4 ±0.02. Hence the triple points parameters are T = 0.542 ±0.0005 and P = 1.6 ·10-4 ±0.02.
A2.23: See Fig .2.6
A2.24: During the fast cooling the condensation rate is higher than the evaporation
rate. It means that the density of gas surrounding the liquid is higher than
the equilibrium one. During the fast heating the evaporation rate is higher
than the condensation rate. It means that the density of gas is lower than the
equilibrium one. During cooling, the gas is supercooled or supersatured. During
heating the liquid is superheated. The equilibrium pressure must be in between
the two curves. Above T = 0.73 the liquid does not exist and both curves coincide.
A2.25: The slope is about -4 See Sect. 2.2.1.
A2.26: The slopes is -6.