HandsOn 13 - Growing a Pattern in the Laboratory
III. Doing the Experiment
Divide the tasks among your partner(s). You will need to measure and record the following during the experiment on a copy of Table :
| |
2. The radius of the pattern at each recorded time.
3. The current at each recorded time.
| t | I | r |
|
Nt | |
| 20 | 20 | ||||
| 20 | 40 | ||||
| 20 | 60 | ||||
| 20 | 80 | ||||
| 20 | 100 | ||||
| 20 | 120 | ||||
| 20 | 140 | ||||
| 20 | 160 | ||||
| 20 | 180 | ||||
| 20 | 200 | ||||
| 20 | 220 | ||||
| 20 | 240 | ||||
| 20 | 260 | ||||
| 20 | 280 | ||||
| 20 | 300 |
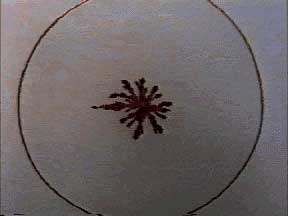
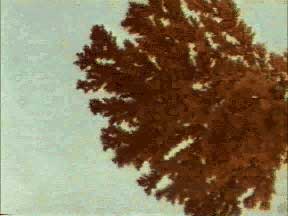
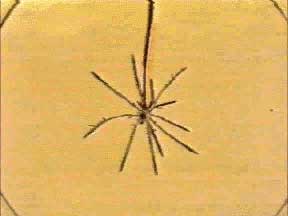
With respect to the radius, the growth may not be symmetric, and some branches may stop growing during the experiment. The investigator recording the "radius'' may choose to measure the overall radius of the entire pattern or the length of an "average'' branch.
A typical procedure might be that the timekeeper watches the clock and announces the time every 20 seconds. The second person reads the current on the ammeter, and the third measures the radius of the deposit. The timekeeper records these two numbers.
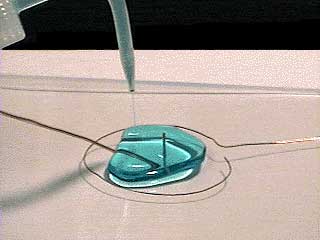
Hook up the circuit shown in Figure 4.2. Depending on the time available, you may want to try several experiments using different voltages. As a guide, 1 and 20 volts are probably the low and high values. Try a value between 10 and 15 volts to begin with.
Now it is time to grow your aggregate. The current will start at a low value, 10 milliamps or so, and rise to between 100 and 250 milliamps as the aggregate grows outward. Take care not to let the aggregate grow so large that it reaches the positive terminal. What might happen if it does?
|
Digitize your electrodeposition aggregates by using a digital camera
or a scanner. Since your aggregate is fragile, make sure you digitize
the experiment immediately after you finish the experiment. You
will need this digitized image for the section on measuring the
fractal dimension.
 |
 |
 |
 |